-
Grégoire Lecerf
Joris van der Hoeven
Joris van der Hoeven
mailing-list for TeXmacs Users
Text archives Help
From : BB <address@hidden>- To: texmacs-users <address@hidden>
- Subject: Re: [TeXmacs] a small function plotter for TeXmacs
- Date: Fri, 26 Jan 2018 20:22:51 +0100
Dear Shelby,
1) To select an image ( that contains a graph ) you can double-click on the right side close to of its field.
Once it is selected, the rectangular field appears lightly in grey.
Then you can copy it ( cmd c ) or cut it (cmd x ).
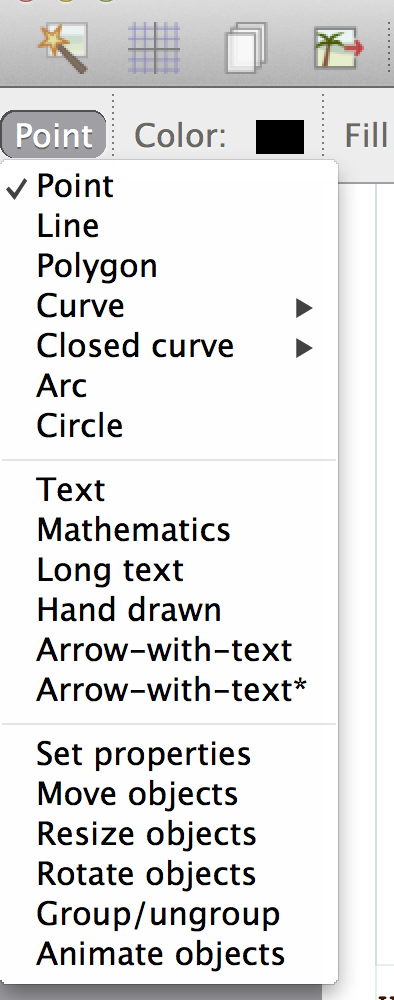
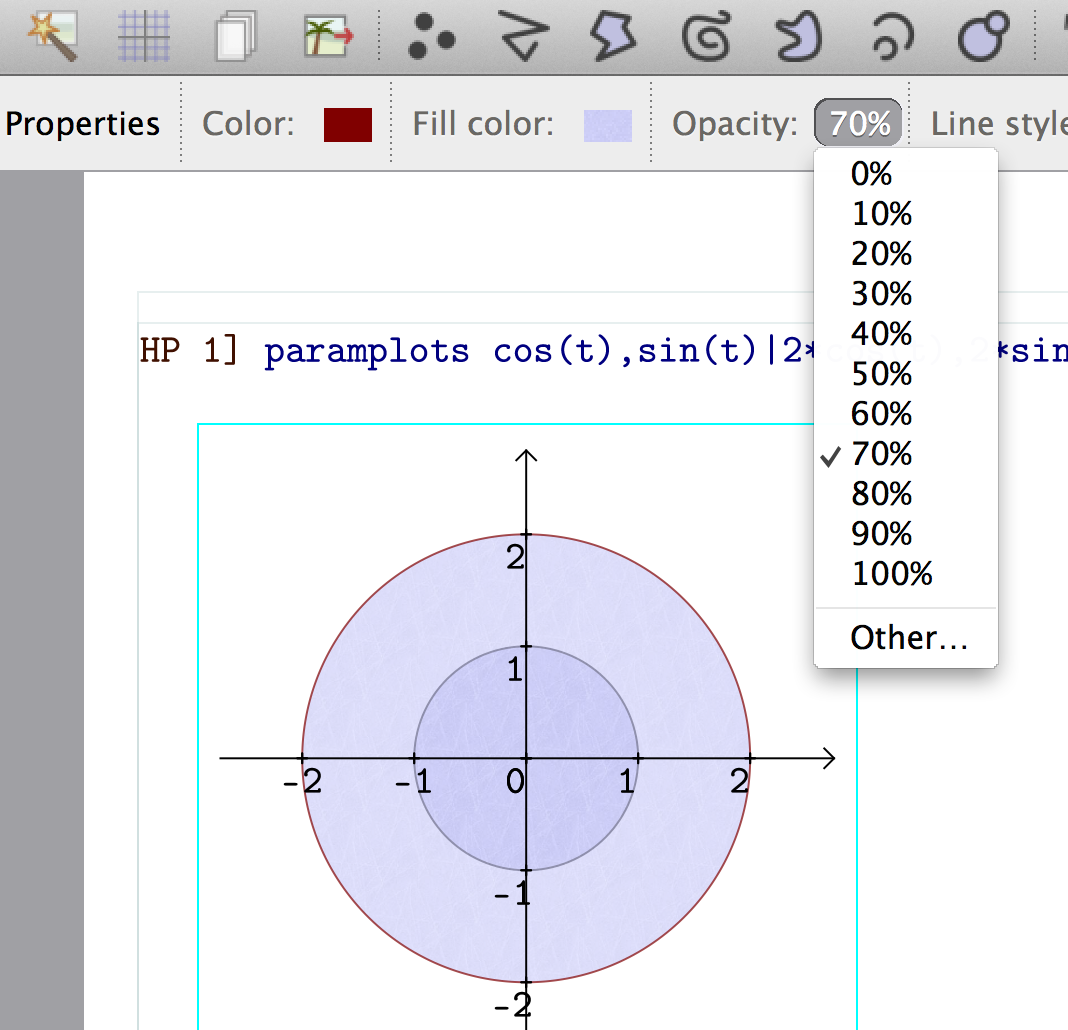
2) To change the color of the curve, or its line-style, or its color filling, its opacity … use the command Set Properties from the menu ( first pict ) and then select the curve and the surface you want to modify.
For the change from fig.1 to fig.2 I colored and white ( with opacity 100% ) the surface under the horizontal. Then change whatever you want (second pict )
For the change from fig.2 to fig.3 I changed the unit ( something like 1.5cm in place of 1cm ) and I introduced a cartesian grid.
Have a nice week-end,
Bertrand
- Re: [TeXmacs] a small function plotter for TeXmacs, BB, 01/05/2018
- <Possible follow-up(s)>
- Re: [TeXmacs] a small function plotter for TeXmacs, BB, 01/15/2018
- Re: [TeXmacs] a small function plotter for TeXmacs, BB, 01/15/2018
- Re: [TeXmacs] a small function plotter for TeXmacs, Shelby Hui-Jun Chen, 01/16/2018
- Message not available
- Re: [TeXmacs] a small function plotter for TeXmacs, BB, 01/17/2018
- Re: [TeXmacs] a small function plotter for TeXmacs, Shelby Hui-Jun Chen, 01/26/2018
- Re: [TeXmacs] a small function plotter for TeXmacs, BB, 01/26/2018
- Re: [TeXmacs] a small function plotter for TeXmacs, Shelby Hui-Jun Chen, 01/27/2018
- Re: [TeXmacs] a small function plotter for TeXmacs, BB, 01/26/2018
- Re: [TeXmacs] a small function plotter for TeXmacs, Shelby Hui-Jun Chen, 01/26/2018
- Re: [TeXmacs] a small function plotter for TeXmacs, BB, 01/17/2018
- Re: [TeXmacs] a small function plotter for TeXmacs, BB, 01/15/2018
Archive powered by MHonArc 2.6.19.